PIVPy visualization
This page summarizes PIVPy’s visualization helpers. It is centered around PIVPy’s PIVMat-inspired entry point showf (“show field”), which can display either a still frame or a time-series.
Overview
The main entry points are:
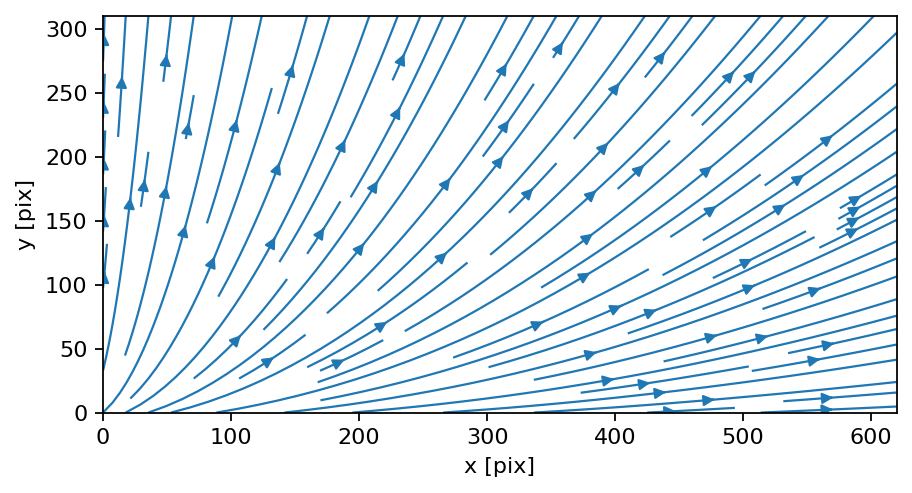
pivpy.graphics.showf()(andxarray.Dataset.piv.showf()) - vector fields: draws arrows, optional scalar background - scalar fields: draws a color-mapped scalar fieldpivpy.graphics.quiver()/xarray.Dataset.piv.quiver()- vector-only quiver plot with helpful options like subsampling (nthArr)pivpy.graphics.streamplot()/xarray.Dataset.piv.streamplot()- streamlines for vector fieldsxarray.Dataset.piv.to_movie()- render a time-series into a movie (mp4/gif) or return frames
Most plots accept Matplotlib-style keyword arguments (colormap, limits, etc.).
Still images
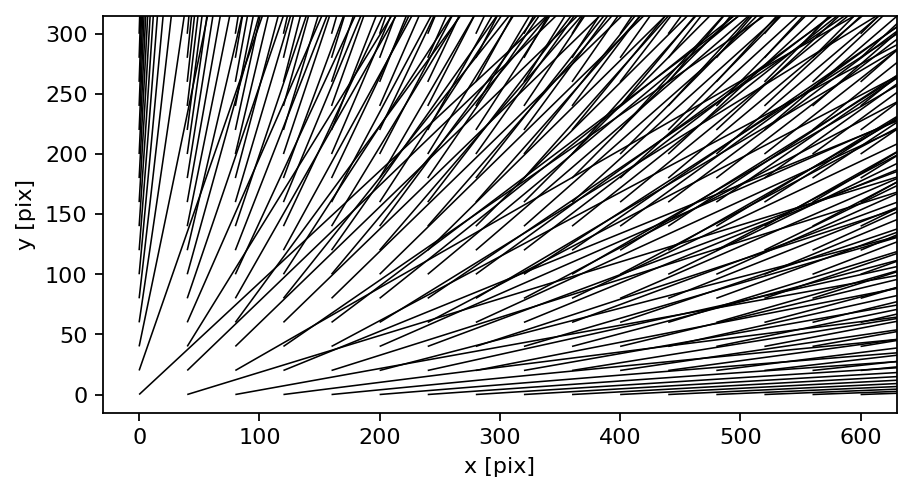
Vector field (arrows)
import pivpy.pivpy  # registers Dataset.piv
from pivpy import io

ds = io.create_sample_Dataset(n_frames=1)
ds.isel(t=0).piv.showf()
Subsample arrows (like “spacing” in other toolboxes)
Dense grids can be hard to read. Use nthArr to display every Nth vector:
ds.isel(t=0).piv.showf(nthArr=2)
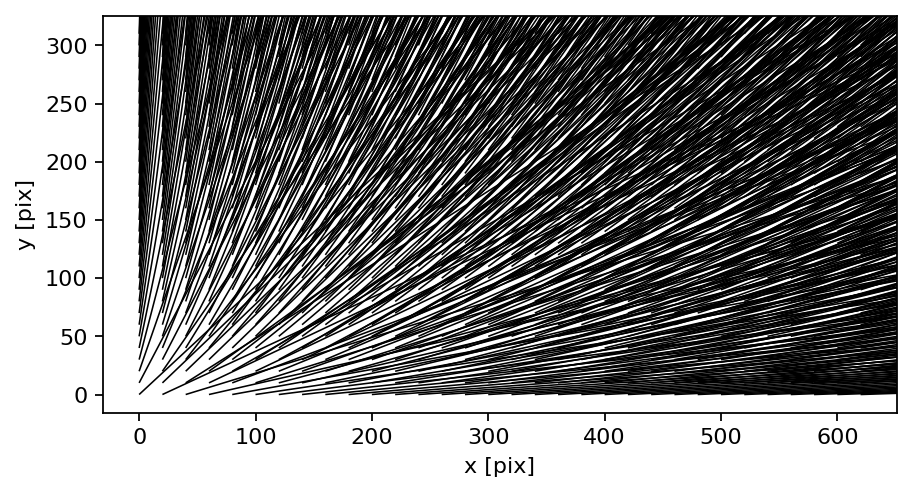
Vector field with a scalar background
If you pass a background name, PIVPy will either:
show an existing variable with that name, or
compute it via ds.piv.vec2scal(background, name=’w’).
Example (vorticity background):
ds.isel(t=0).piv.showf(background="vorticity")
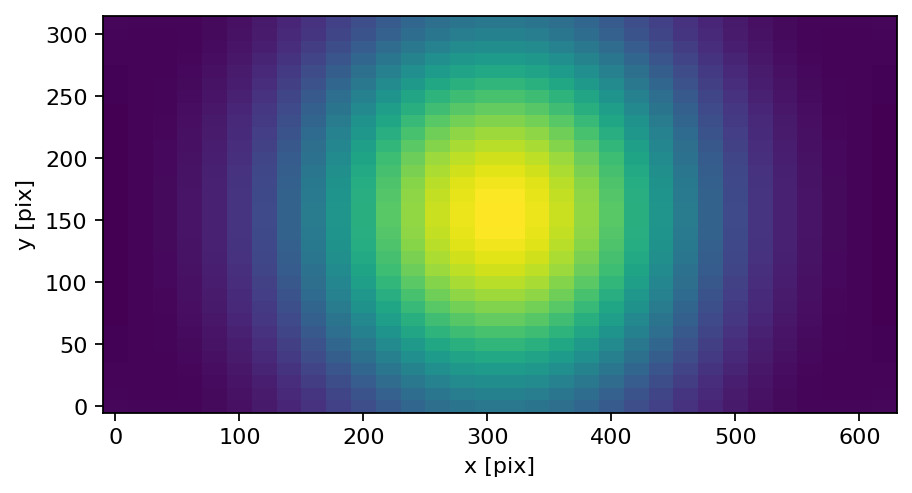
Scalar fields
Scalar datasets (variable w) can be displayed directly:
vort = ds.isel(t=0).piv.vec2scal("vorticity", name="w")
vort.piv.showf(scalar="w", cmap="viridis")
Movies
If you have multiple frames along t, you can render a movie:
ds = io.create_sample_Dataset(n_frames=10)
ds.piv.to_movie("movie.mp4", background="vorticity", nthArr=2)
Gallery
The images below are generated using PIVPy plotting functions.
|
|
|
|
Notes
Interactive “live” movie key bindings like MATLAB’s figure callbacks are not a PIVPy goal. For interactive exploration, consider using Jupyter notebooks and Matplotlib widgets.
If your y-axis appears flipped, check the ordering of the y coordinate. PIVPy’s plotting utilities attempt to respect coordinate ordering.