Note
Looking for a written, copy/paste friendly version? See PIVPy tutorial.
PIVPy graphics tutorial
[1]:
# import xarray as xr
# import numpy as np
from pivpy import io, pivpy, graphics
import matplotlib.pyplot as plt
[2]:
## Let's create a sample dataset
[3]:
df = io.create_sample_Dataset()
df
[3]:
<xarray.Dataset> Size: 5kB
Dimensions:  (y: 10, x: 11, t: 2)
Coordinates:
  * y        (y) float64 80B 0.0 10.0 20.0 30.0 40.0 50.0 60.0 70.0 80.0 90.0
  * x        (x) float64 88B 0.0 20.0 40.0 60.0 80.0 ... 140.0 160.0 180.0 200.0
  * t        (t) float64 16B 0.0 1.0
Data variables:
    u        (y, x, t) float64 2kB 1.0 1.0 2.0 2.0 3.0 ... 10.0 10.0 11.0 11.0
    v        (y, x, t) float64 2kB 1.0 1.0 1.0 1.0 1.0 ... 10.0 10.0 10.0 10.0
    chc      (y, x, t) float64 2kB 1.0 1.0 1.0 1.0 1.0 ... 1.0 1.0 1.0 1.0 1.0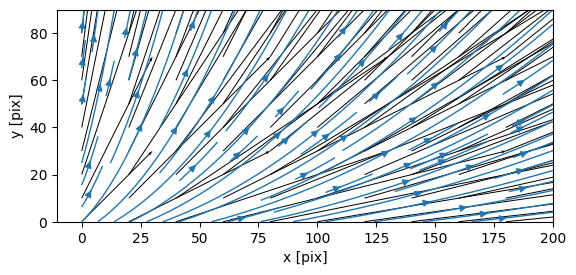
Attributes: (2)[4]:
plt.figure(figsize=(10,10))
graphics.quiver(df.piv.average,arrScale=3,streamlines=True);
<Figure size 1000x1000 with 0 Axes>
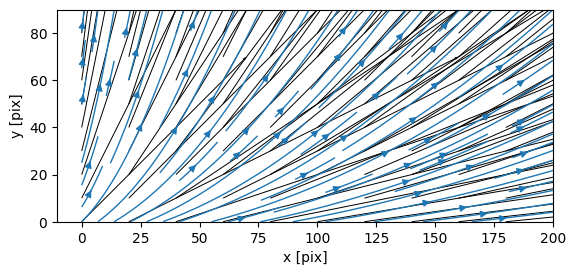
[5]:
plt.figure(figsize=(10,10))
# plot quiver of the first frame (t[0]), selected by .isel and apply quiver()
df.isel(t=0).piv.quiver(arrScale=7,streamlines=True)
[5]:
(<Figure size 640x480 with 1 Axes>, <Axes: xlabel='x [pix]', ylabel='y [pix]'>)
<Figure size 1000x1000 with 0 Axes>
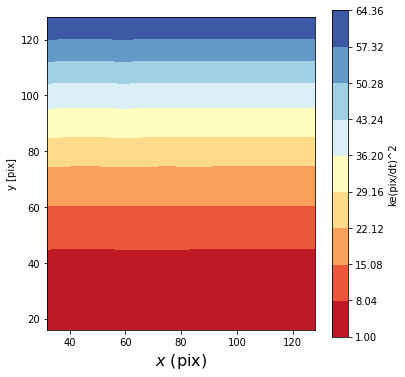
[6]:
fig,ax = graphics.contour_plot(df.isel(t=-1),colorbar='vertical')
fig.set_size_inches(6,6)
ax.set_xlabel('$x$ (pix)',fontsize=16);